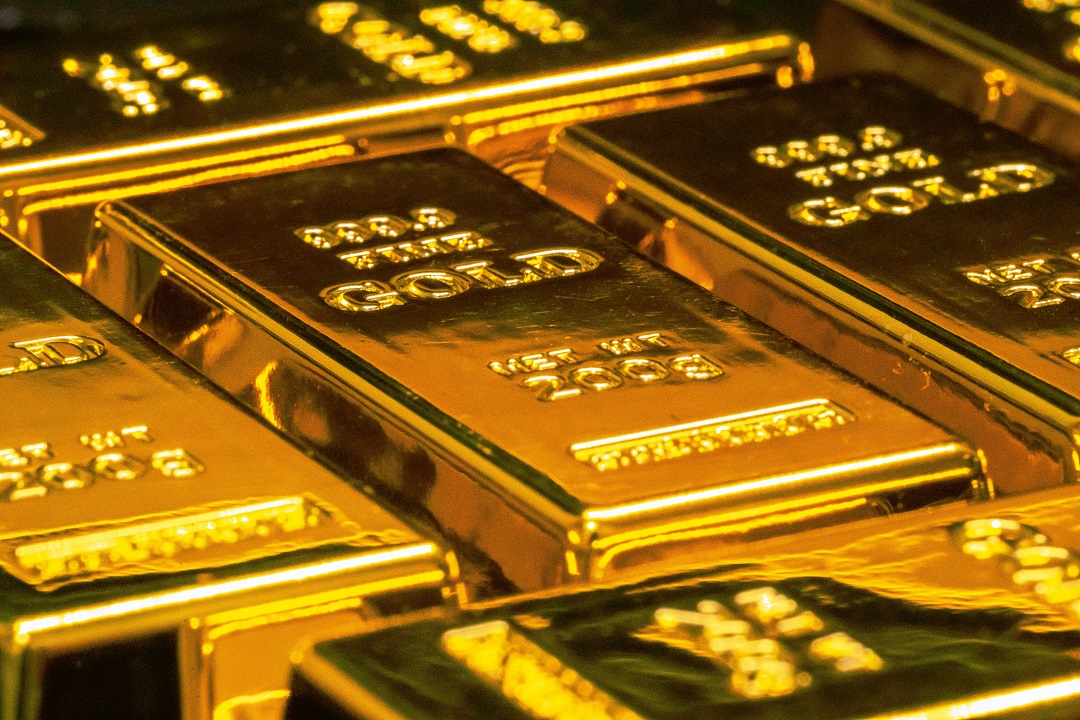
Gold prices retreated Friday as the dollar recovered and investors weighed the prospect of higher US interest rates. The Comex continuous contract fell 1.6% to $4,037.86 an ounce by late morning in New York, while December gold dropped 1.5% to $4,099.50.
Despite the decline, gold was on track for its first monthly gain since February. The Federal Reserve held its benchmark rate at 3.50% to 3.75% on Wednesday in a 9-3 vote, with three officials preferring a quarter-point increase. Markets put the probability of a September hike at about 63%, creating a headwind for non-yielding gold.
“Gold struggles to regain meaningful momentum and remains in the corrective phase of a broader structural bull market,” independent analyst Ross Norman told Reuters.
Supply Reaches a Q2 High
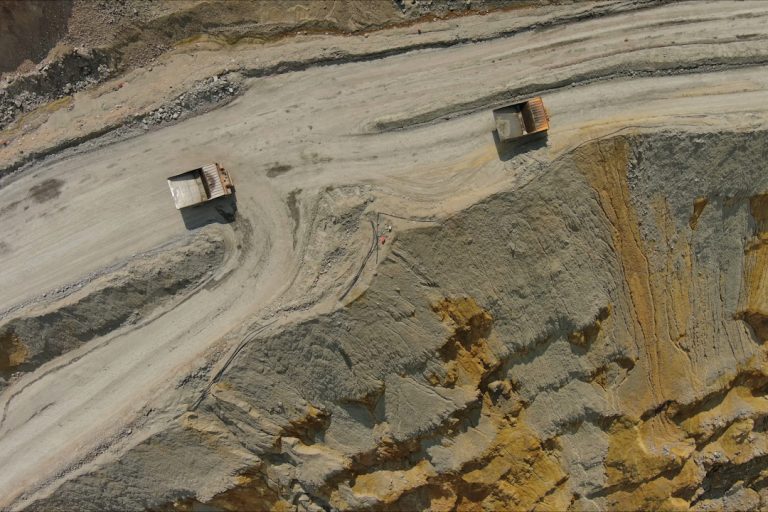
The World Gold Council’s latest Gold Demand Trends report showed mine production rose 2% year over year to 966 tonnes in the second quarter, the highest Q2 total in its series. First-half production reached a record 1,867 tonnes, up 3% from 1,808 tonnes a year earlier.
Average industry all-in sustaining costs reached a record $1,785 an ounce in the first quarter, the latest period with complete data. That was 5% higher quarter over quarter and 16% higher year over year, driven mainly by increased royalties and corporate overhead.
The first-quarter gold price averaged $4,872.90 an ounce, leaving a price-to-AISC spread of about $3,088 an ounce. That spread is not the same as net profit because AISC does not include every corporate, financing, or tax expense.
The WGC said some mines were already seeing higher energy costs from the Middle East conflict and expects a greater effect from the second quarter onward. Canada, Chile, Burkina Faso, and Ghana recorded notable production gains, while Nicaragua, Mexico, the United States, and China posted declines.
Recycling fell 6% year over year to 326 tonnes as lower prices discouraged selling. With mine gains offset by reduced recycling and an estimated 23 tonnes of producer de-hedging, total supply was essentially unchanged at 1,269 tonnes.
Central Banks Rebound
Total gold demand, including over-the-counter activity, was also flat at 1,269 tonnes in Q2. First-half demand rose 2% to 2,522 tonnes and reached a record value of $380 billion.
Central-bank net purchases climbed to 289 tonnes, up 62% year over year and five times the revised first-quarter level. It was a record for a second quarter. Poland led reported buying with 51 tonnes, followed by China with 33 tonnes. However, first-half central-bank demand of 345 tonnes was the lowest since 2022.
Investment demand excluding OTC transactions fell 46% to 262 tonnes. Gold-backed ETFs shed 45 tonnes, while bar-and-coin demand was broadly steady at 307 tonnes. OTC and stock flows rose 91% to 327 tonnes.
Jewelry demand fell 17% to 278 tonnes as high prices reduced affordability, although spending rose 14% to $40 billion. China’s demand dropped 28% to 50 tonnes, while India fell 15% to 75 tonnes. Technology demand increased 2% to 80 tonnes, supported by AI-related uses.
The WGC expects investment to remain the main source of demand growth through the rest of 2026. It forecasts continued central-bank buying, though below 2025 levels, while high prices are expected to keep jewelry volumes under pressure and limit growth in mine supply and recycling.
Sources
- Mining.com — Gold price: record gold output, record cost per ounce
- World Gold Council — Gold Demand Trends: Q2 2026
- World Gold Council — Supply
- World Gold Council — Central Banks
- Federal Reserve — July 29, 2026 FOMC Statement
- Reuters — Gold retreats but poised to end best month since February
Editorial Disclosure
This article is based entirely on publicly available information, including press releases, SEC/SEDAR filings, and publicly available news sources. No individual company security or ticker is discussed or referenced in this article. MiningMarketsReport.com has not received any compensation from any company mentioned, its management, investor relations representatives, or any third party for this specific article. MiningMarketsReport.com may have current or past paid business relationships with other companies, which does not influence the content or conclusions of this article. No staff member or principal of MiningMarketsReport.com holds a position in any security mentioned at the time of publication.
Sources include the World Gold Council’s Gold Demand Trends: Q2 2026 report and its Supply and Central Banks sections, published July 30, 2026, via WGC Goldhub; the Federal Reserve’s FOMC statement dated July 29, 2026; the Reuters gold market report dated July 31, 2026; and the Mining.com article dated July 31, 2026.
This article discusses global gold-market supply, demand, costs, and pricing rather than the financial position of a specific issuer. Mine-production, demand, and cost figures are historical estimates and may be revised. Industry all-in sustaining cost figures do not represent the net profit of an individual mining company.
Market prices and interest-rate probability estimates are as of July 31, 2026. World Gold Council supply-and-demand data cover the second quarter and first half ended June 30, 2026, while the latest complete industry cost data cover the first quarter of 2026. Gold prices and market expectations can change rapidly, and readers should verify current figures.
These are speculative investments carrying significant risk, including potential total loss of capital. Coverage on MiningMarketsReport.com is provided for informational and educational purposes only. MiningMarketsReport.com is not a registered investment advisor. Nothing in this article constitutes financial, investment, or professional advice. Readers are encouraged to conduct their own due diligence and consult a qualified financial advisor before making any investment decisions. For more information, please see our full DISCLAIMER.